Create Effective Data Visualisation with Visme Infographics & Charts!

As global businesses scramble towards a smarter and data-driven culture, often, the question pops; “How to start?”. In this article, we’ll share how anyone can create effective data visualization with a free online editor called Visme. With such a powerful tool free to use, why wouldn’t anyone try?
Follow through this article to understand Visme features and what anyone can do with it. As illustration, we had also created 2 data visualization out of Visme all within the day as we write! Keen to know what you too can do with it? Read on!
The world wide web is huge, and yet you had stumbled on my site looking for something. I hope you find it as we had taken huge efforts to create them. Best of all, its FREE! Hence, some of our content may include affiliate links (i.e. whenever you click on the links and purchase, I earn a small commission at no extra costs to you!). No worries! Some of these links may look like phishing, but I assure you they are not! Lastly, the affiliation does not affect my reviews towards them. Enjoy!
- Getting Started with Visme
- Select a Template
- Interface & Common Techniques
- Customisation
- Finalize Designs
- Our Final Output
1. Getting Started with Visme
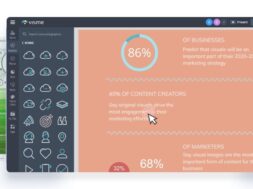
Visme is your all-in-one platform for creating beautiful presentations, documents, data visualizations, videos, and other professional business content. In this article, we’ll show how you can visualize your data better with Infographics and Charts made with Visme. To get started, go to Visme website and create an account. You can sign up using either an email, Google, or a Facebook account.
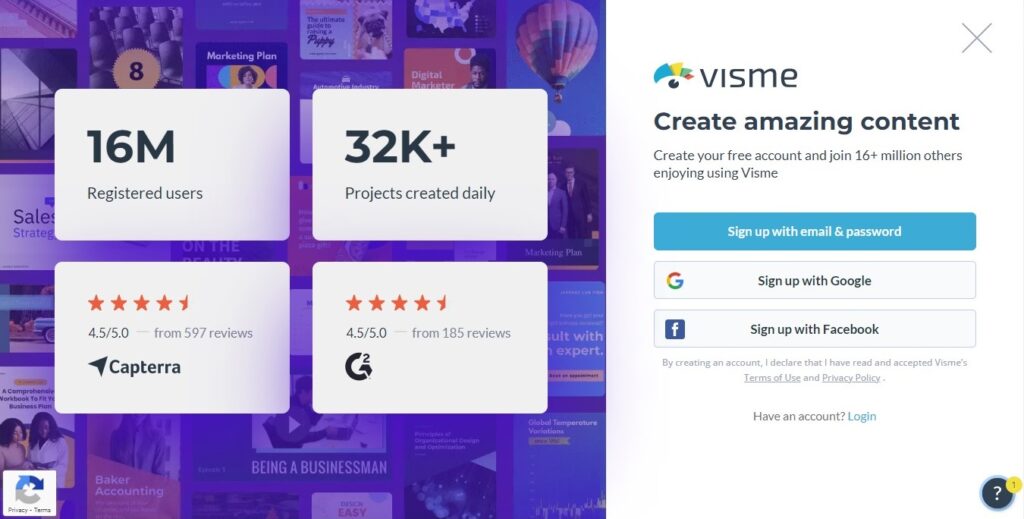
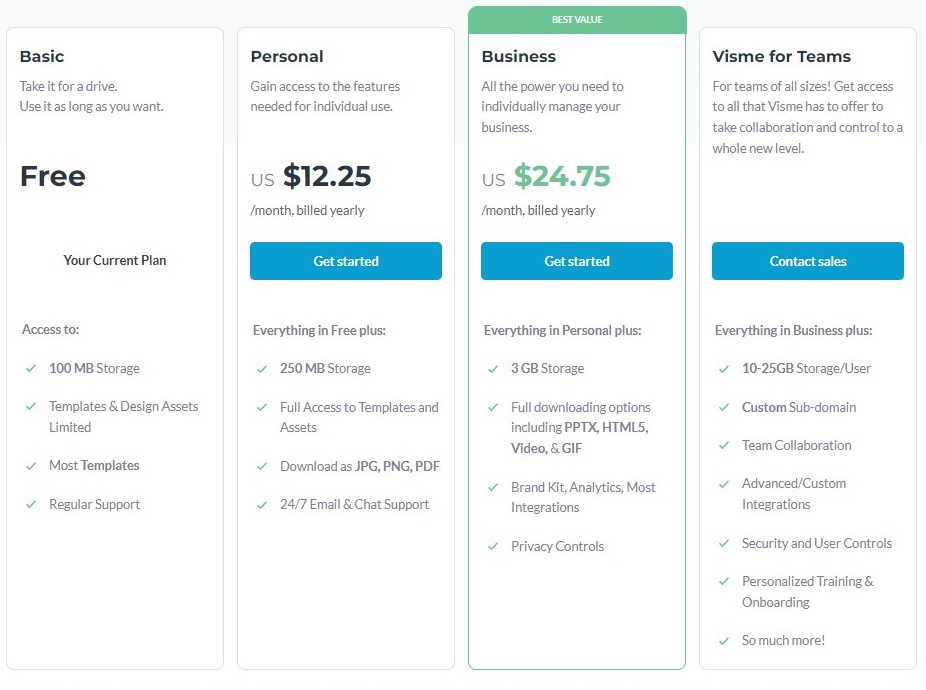
Visme comes with a total of four different pricing plans including the free plan: Basic, Personal, Business, and Visme for Teams. While you can choose any pricing plan that suits your needs, the basic plan (free) offers a great way for you to try most of Visme.
(Comment) As per Visme’s Terms and Conditions of use, only the Business and Enterprise plan will entitle your created designs in Visme for commercial use. Hence, take note of this if you intend to sell your designs or any part of the designs created from Visme’s editor and media assets in its library.
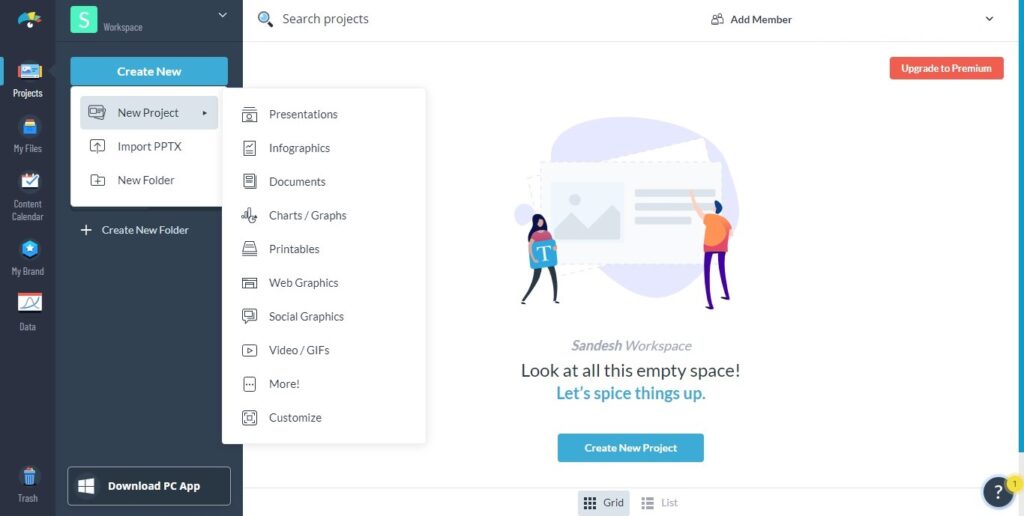
After login, you’ll be redirected to your Visme account dashboard where you’ll be able to create and manage all your projects in Visme.
2. Select a Template
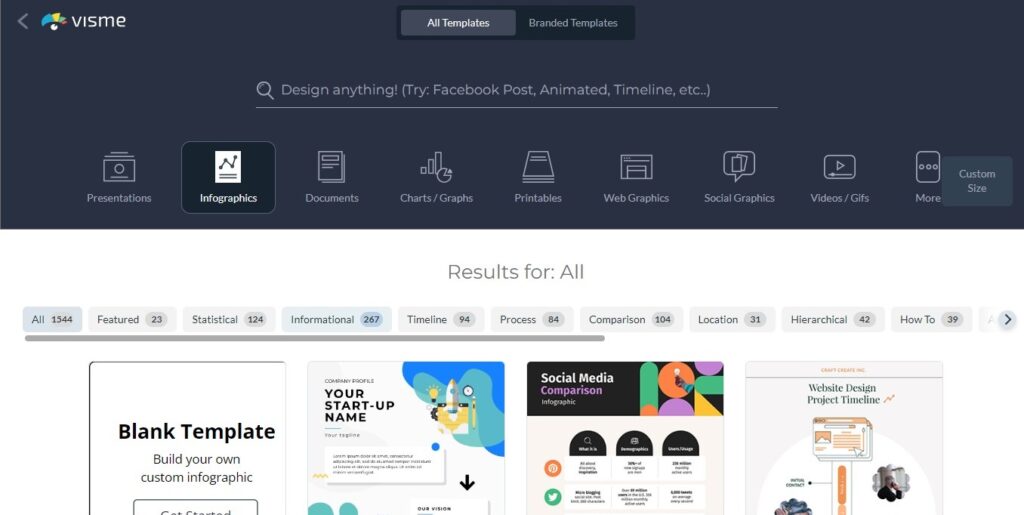
Visme offers thousands of pre-made templates for you to choose from for your project. It has templates for many branding and business purposes such as presentations, flyers, web graphics, videos, social media, etc. What’s more? All of them are well-designed and feature-packed so you’ll surely be able to find one that best suits your needs! Nonetheless, you can still being design from a completely blank canvas from scratch.
Excited to see the templates? Just head over to the templates page.
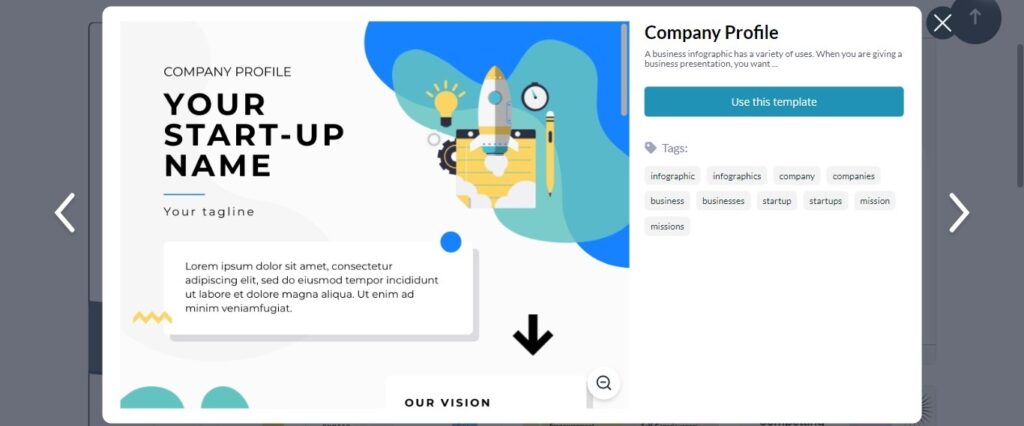
On the templates page, you can browse templates with categories like Presentation, Documents, Infographics, Charts/Graphs, etc. Additionally, you can apply category filters like Statistical, Informational, Timeline, Process, etc. to narrow down your search. Alternatively, search templates directly using the search bar at the top if you really don’t feel like browsing around.
If you spot one that might work, click the template to preview its other pages and other segments. To start customizing it, click ‘Use This Template’ to be brought to Visme editor interface.
(Comment) Its important to know what data and the visualization you want in order to find a closest template that offers it. This will save a lot on additional work and keep customization minimal to the template’s professional look and feel.
3. Interface & Common Techniques
Here, you’ll realise that Visme editor’s interface is neat and exactly not too different from how other online editors look. Hence, you may be eager to start, but we’ll tell you exactly what you need to know first before deep-diving in so you don’t miss the good things! Keep reading!
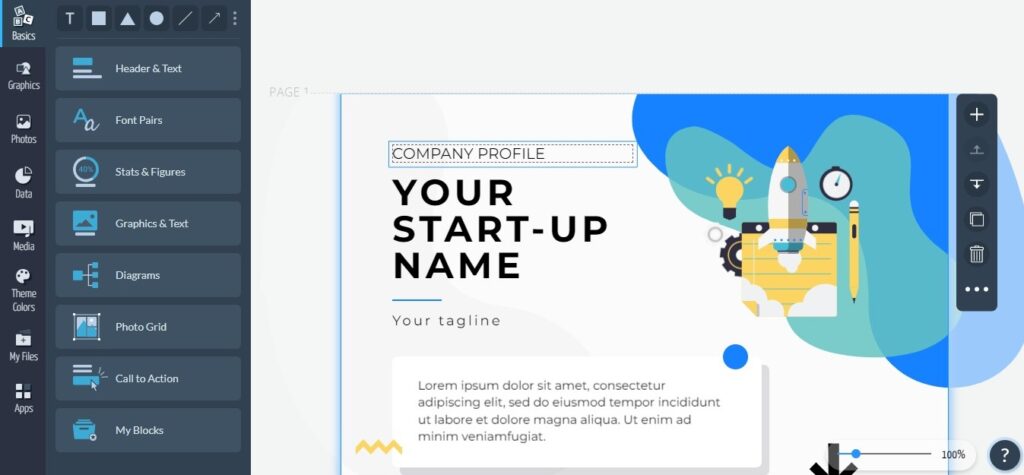
In the Visme editor, we divide it into three sections for ease of explanation: the center, left, and top. The center is our main design canvas where we see how our work turns out in real-time.
The left is the media section or the elements library where we can find different types of elements to use in the design. Here, we can add texts, images, data elements, videos, and audios etc. from Visme’s library or upload from your own local device.
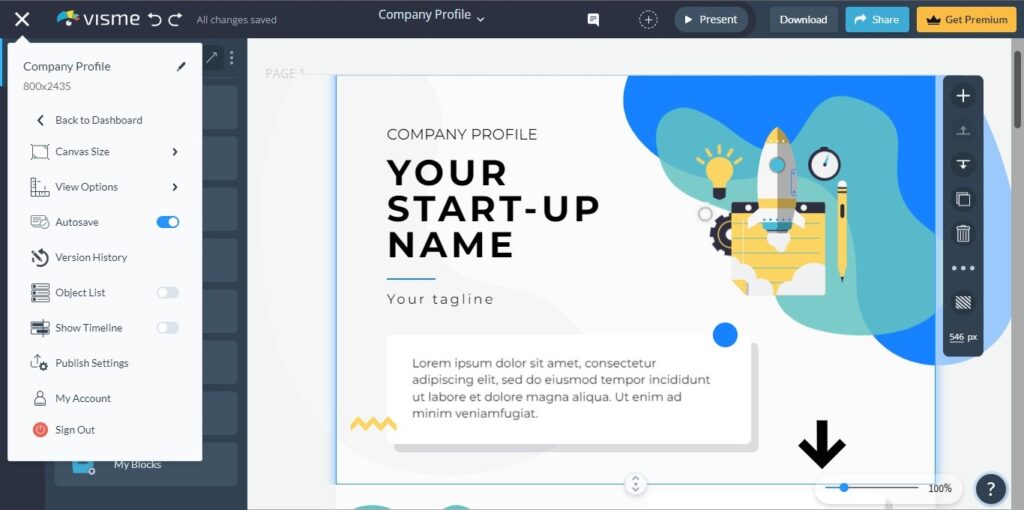
The top section of the editor contains the general and advanced design tools such as Undo & Redo, changing the project title, adding comments and inviting others for collaboration. Moreover, it also has options for presenting the design, downloading, or sharing it with others.
This is a very brief introduction but very essential as we share with you how to perform the common design techniques in Visme. Read on and you won’t be disappointed!
How to Insert Texts, Images, and Other Elements?
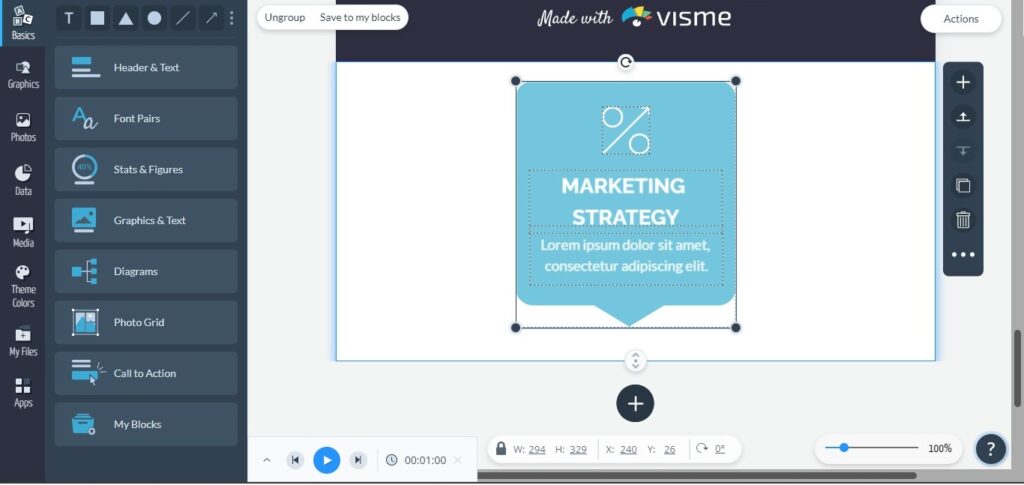
Hover to the left media toolbar to find the element you wish to add. Then, click on it or click-drag to move them into the desired position in the canvas. Thereafter, you can resize and use the advanced tools to customize to desired.
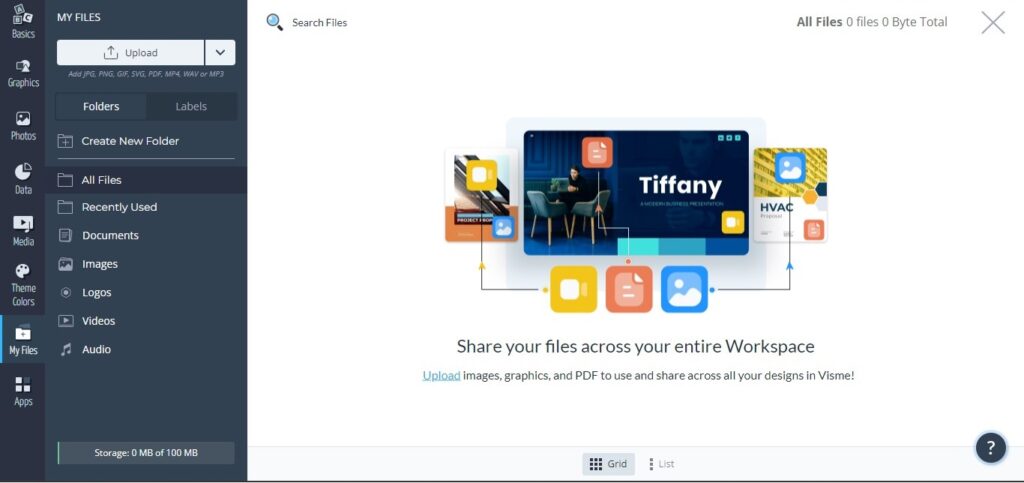
How to Upload Your Own Files and Media?
To upload your own files like images, and audio etc. from your local device, head over to the ‘My Files’ tab in the left and click on the ‘Upload’ button. You can upload files from your cloud storage platforms like Google Drive, Dropbox, and OneDrive too if you connect them to Visme.
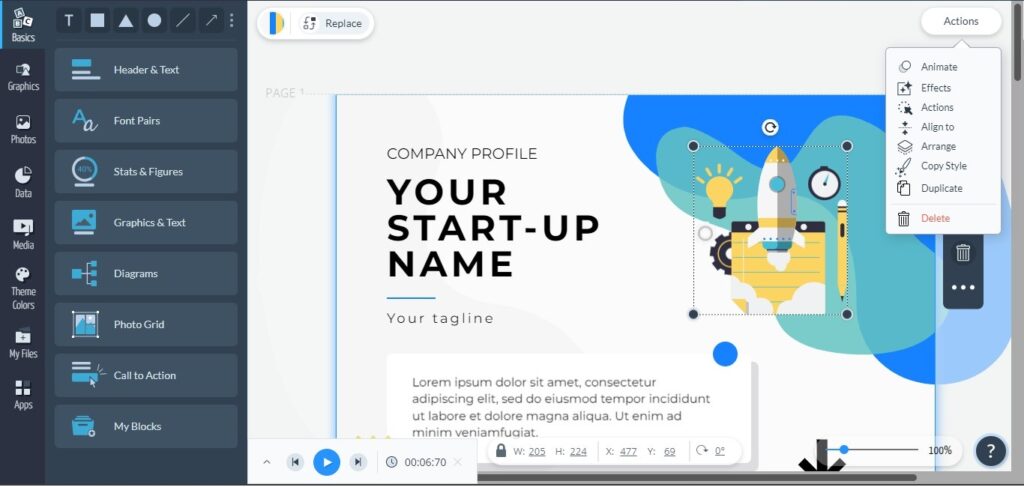
How to Edit Any Elements in the Design?
Each element in the design can be edited and managed individually. You need to single-click or double-click the elements in the center section after which you’ll be shown the available options for editing them. Then, you can perform your edits accordingly like changing colors, aligning them, arranging layers, duplicate, etc. The same can be done by right-clicking on the element.
(Comment) If you can’t find the edit option you want, that means that Visme is unable to apply it to that specific element.
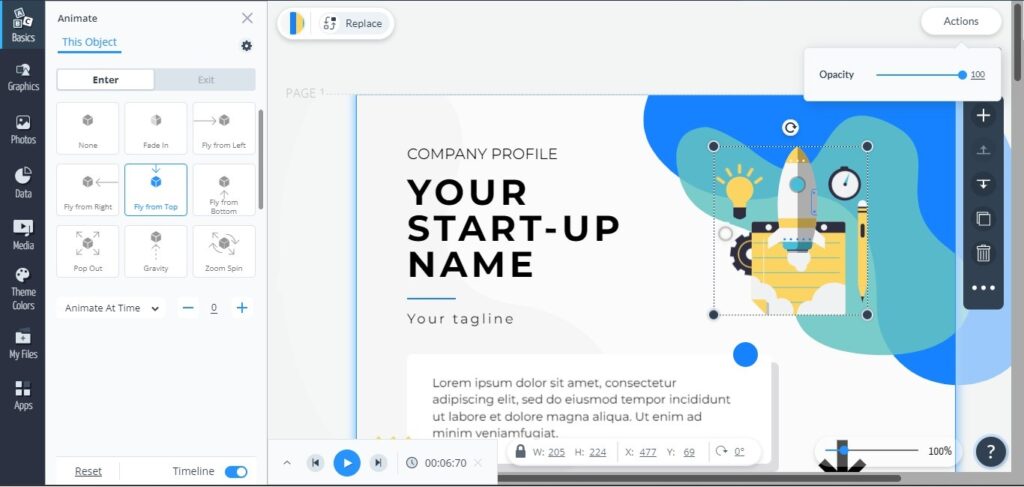
How to Apply Animations and Extra Effects to Any Element?
Applying animations and effects to the elements is just as similar to editing the elements we mentioned above. In the Actions menu of the element, select the ‘Animate’ and ‘Effects’ options. Then, select your preferred animations and effects.
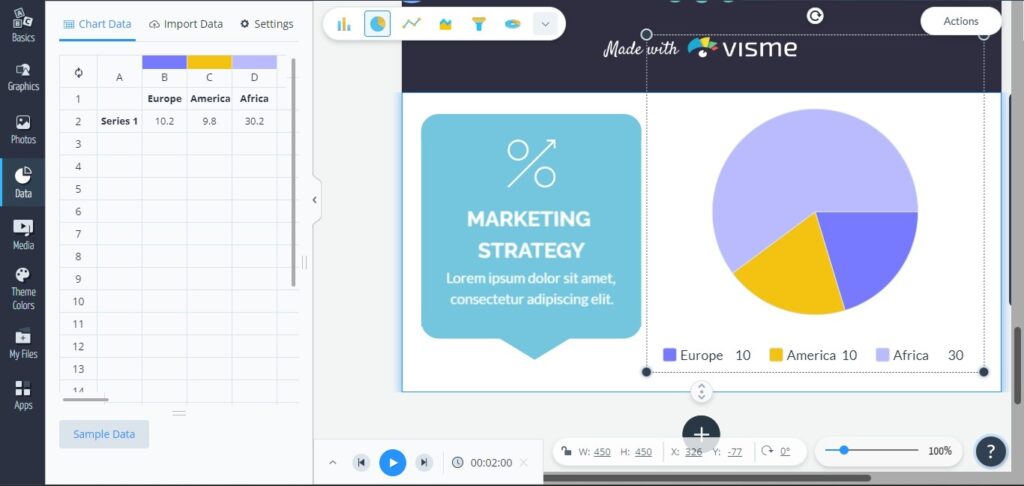
How to Import Data from External Sources and Change Data in Charts/Graphs?
Changing or using your data in charts/ graphs is actually easier than you think. Just click on the data element in the design and modify the data as you would normally do in a spreadsheet from the left toolbar. Alternatively, if you have huge datasets, you can try directly importing them using Google Sheets, Microsoft Excel, and other sources. Then, organize the data accordingly to fit your chart/table.
How to Connect to Third-Party Applications for Extra Functionalities?
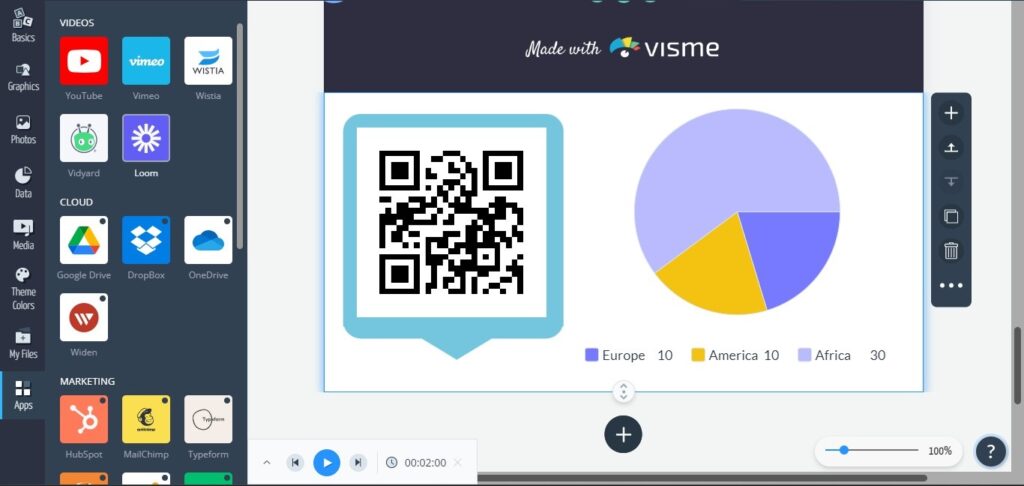
Do you want to embed YouTube or Vimeo videos, or want to insert Google Maps or QR code in your design? Well, Visme allows integration to certain third-party applications for added functionalities although for a Basic plan, very limited integrations are allowed. There are different ways of initiating an integration but they generally can be done from the left media toolbar.
So, now that we understand about the editor, and the basic techniques, let’s move on and apply it to our 2 sample projects; Infographics for NFT, and Covid-19 Chart.
4. Customisation
1. Making an Infographic
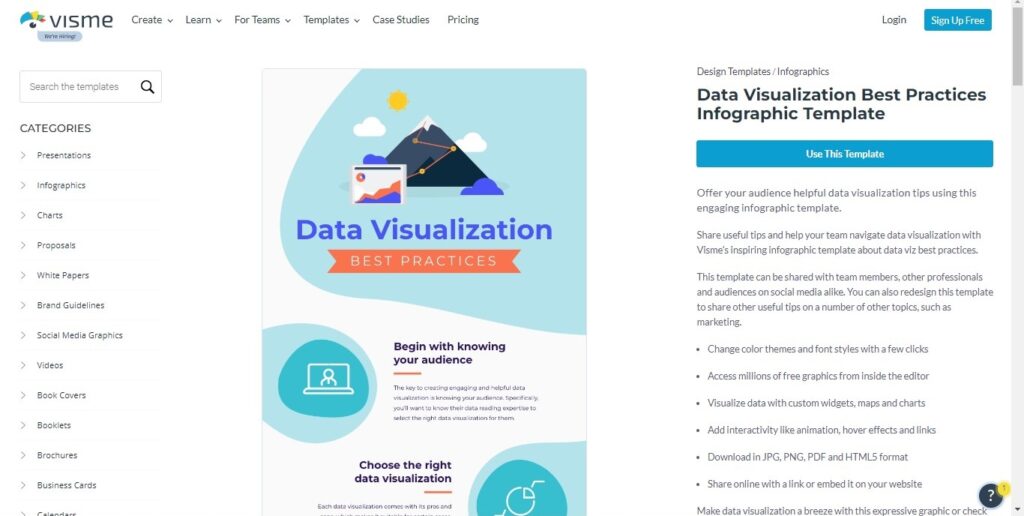
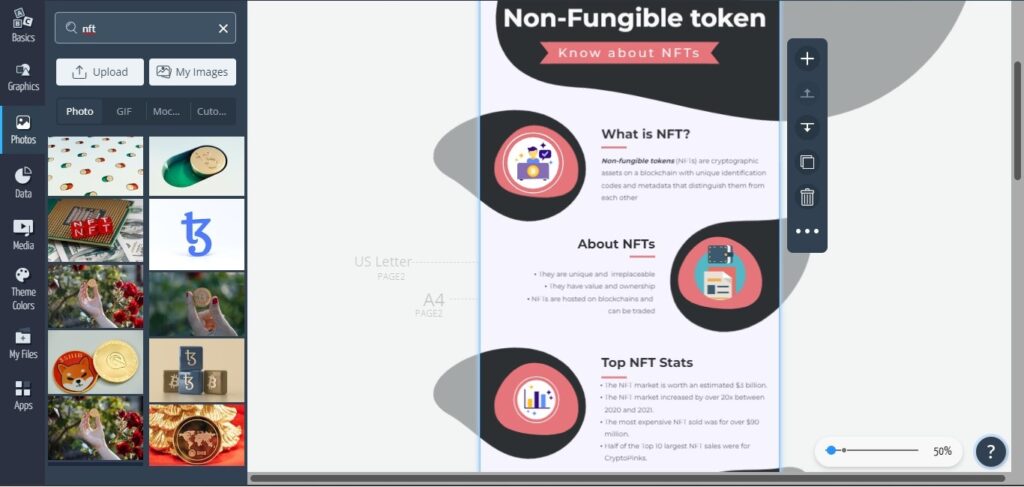
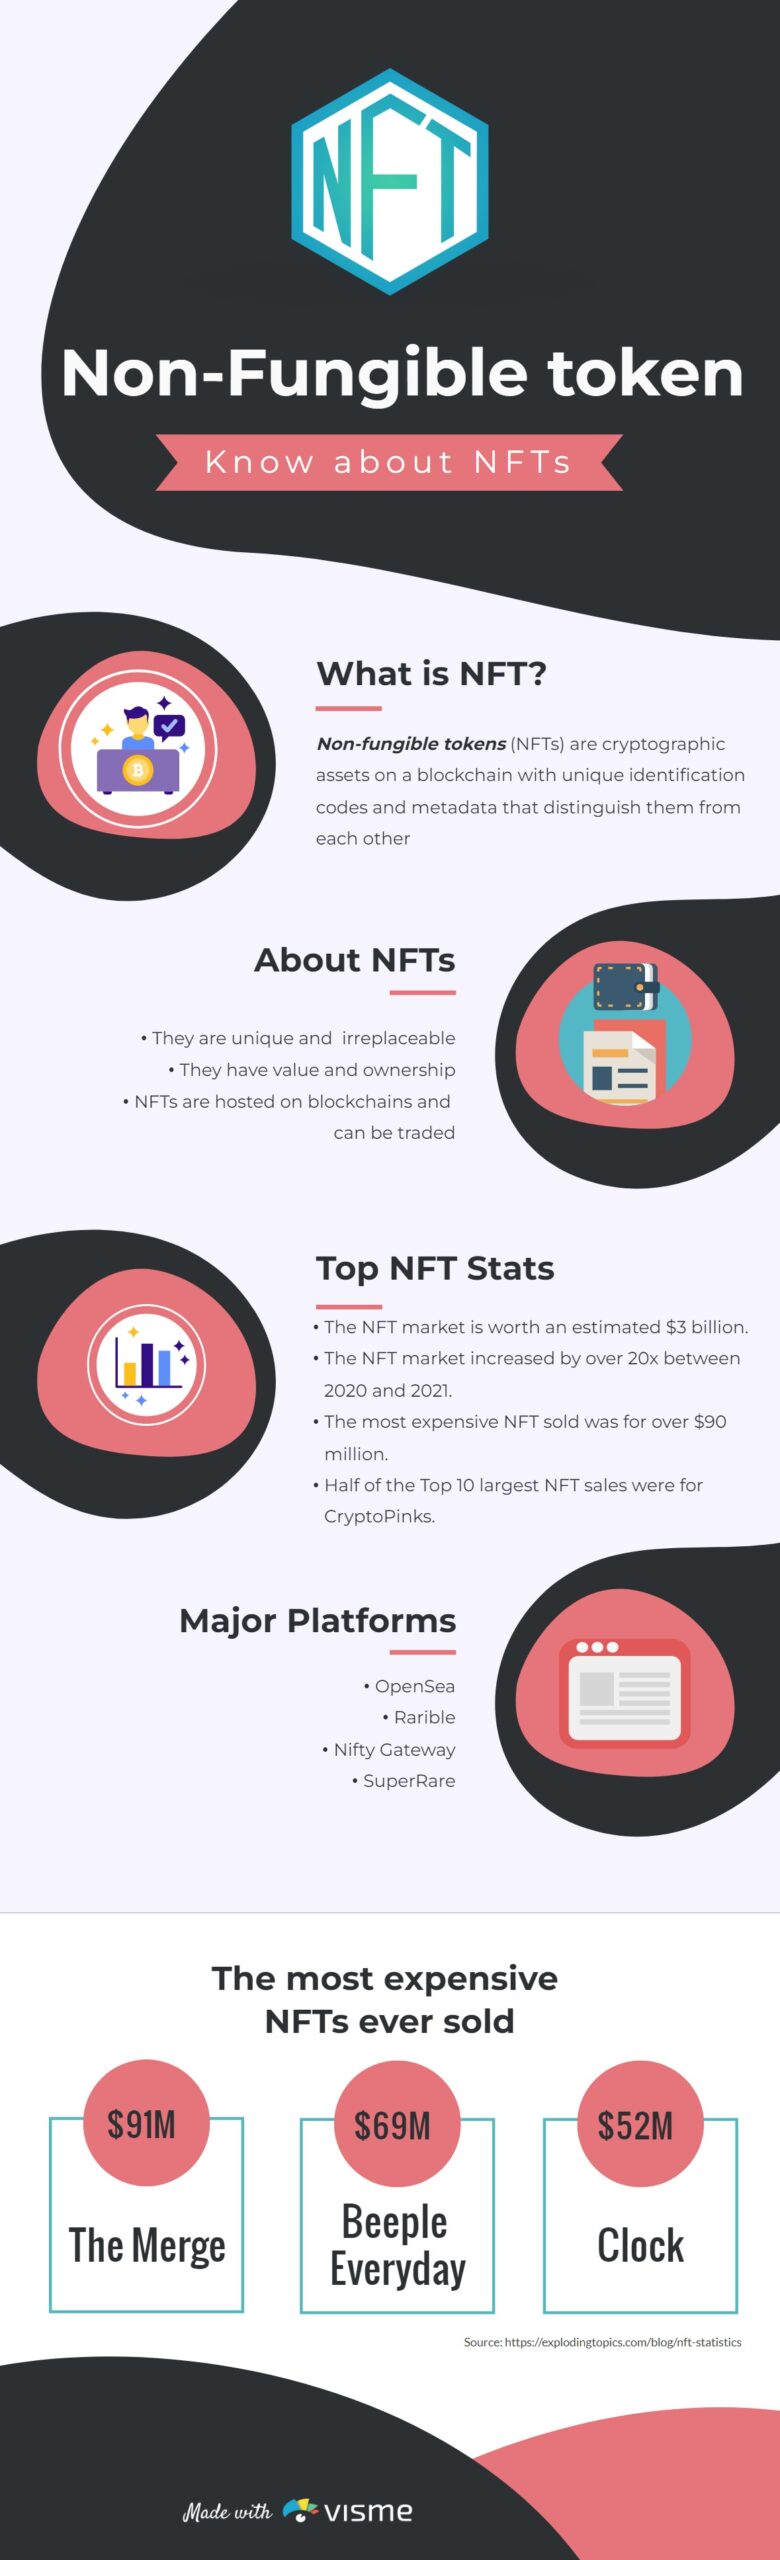
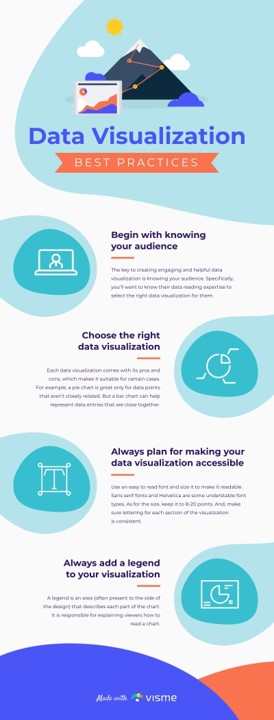
In our first project, we’ll be making a simple infographic about NFTs. The idea for an infographic is such that it is nice and easy to read, yet informative and easy to present. After some browsing, we decided to use the Data Visualization Best Practices Infographic Template since it offers the closest to what we want. Data were obtained from various sources.
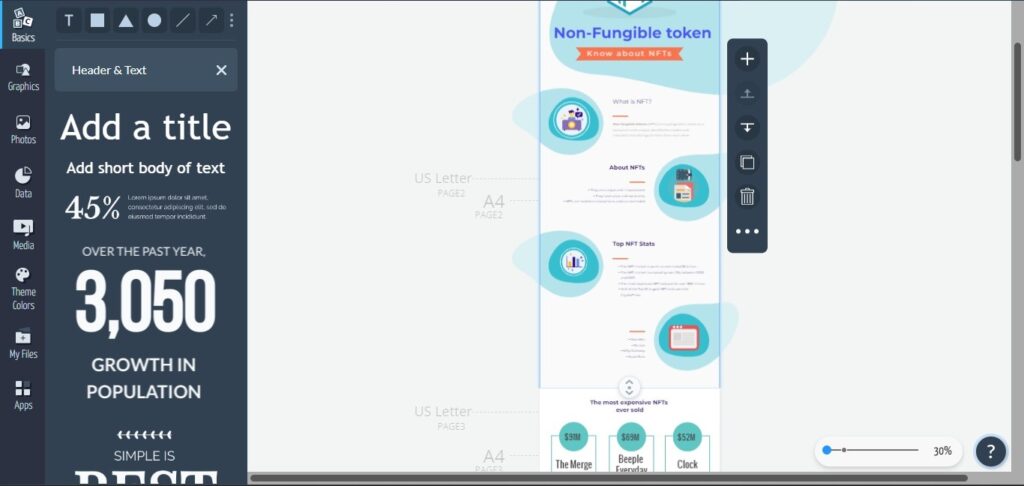
After opening the template, the first thing we did was edit the content (text and images) and replace them with our own because data has the highest priority of all. Then, we added an extra block using the ‘+’ button at the end of the design and inserted a few data elements to represent additional numerical information.
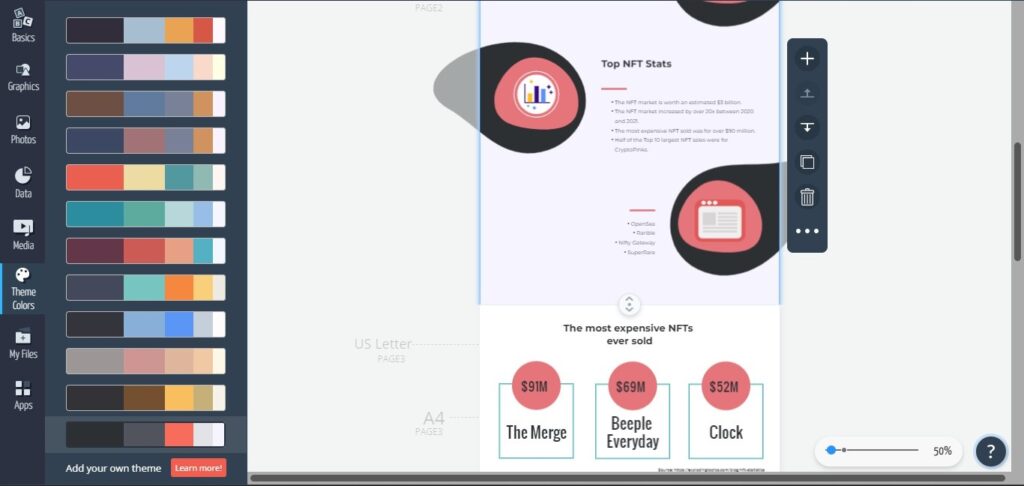
After which, we changed the color scheme of the whole design from the ‘Theme Colors’in the left section and also manually customized some element colours to fit our overall theme and branding. This immediately changed the feel of the whole design and gave our infographic a new look! Basically personalization at best!
Lastly, we did some additional adjustments with fonts, blank spaces, images, animations, etc., and formatted the whole design to make it really professionally consistent! Now, we’re ready to finalise this infographic!
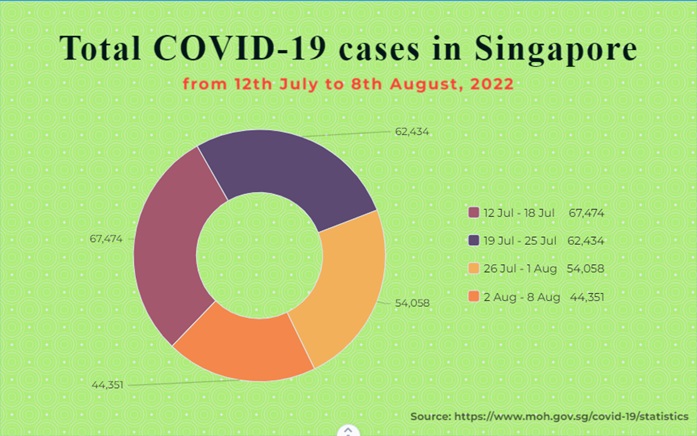
2. Making a Chart
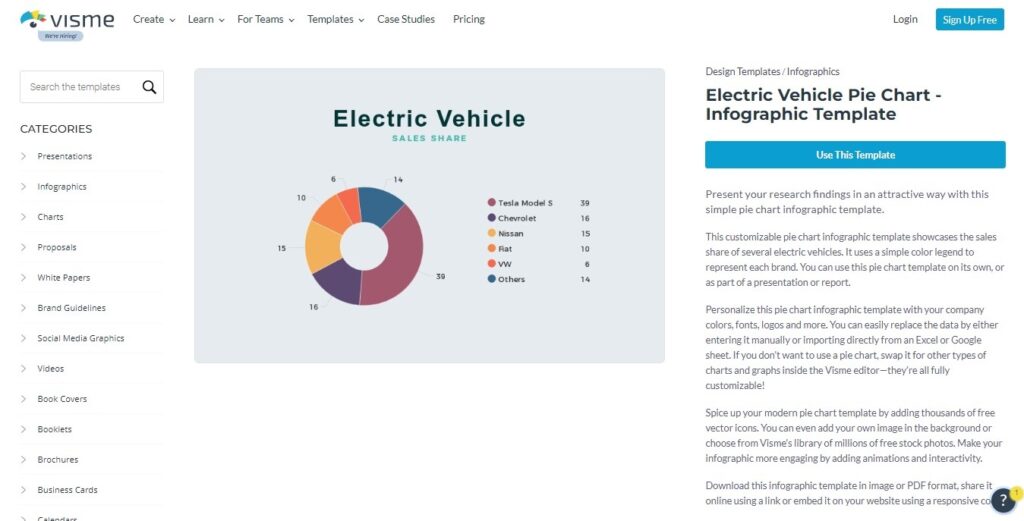
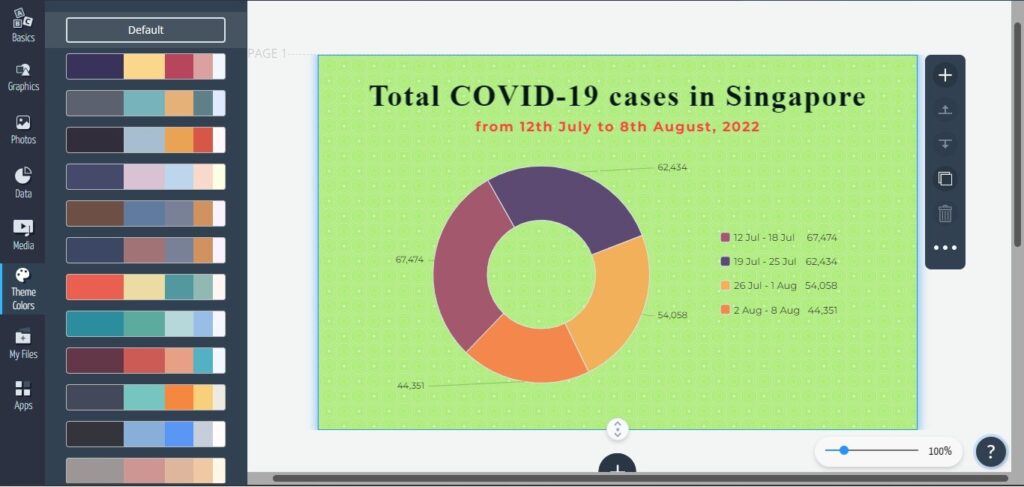
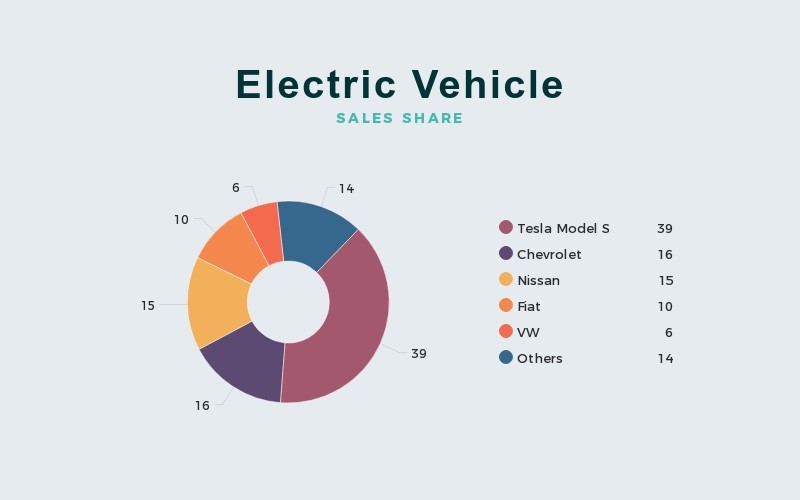
Moving on to the Covid-19 chart. For this sample project, we have data from the Singapore Ministry of Health. With Visme’s category filters, it doesn’t take long for us to spot a viable template in the Electric Vehicle Pie Chart.
To uncomplicate things, we first removed all the additional data columns that we did not need for this design. You can do that by simply clicking on the chart in the center section which opens up a data spreadsheet for editing. You can also add extra columns to the chart if you have bigger sets of data.
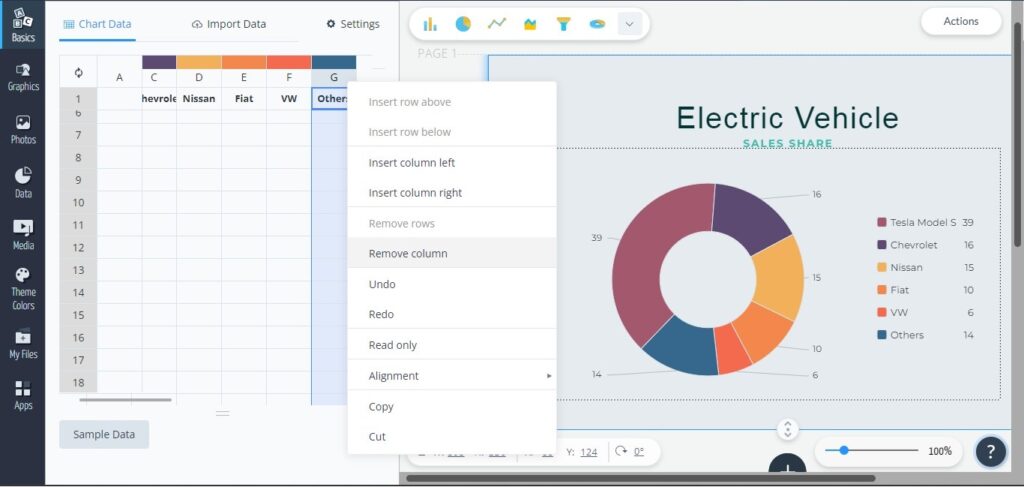
After adding all the columns we need, we populate with the data we have on hand. Then, we just need to edit the data using the spreadsheet at the left toolbar. Our chart will automatically update as we update the data.
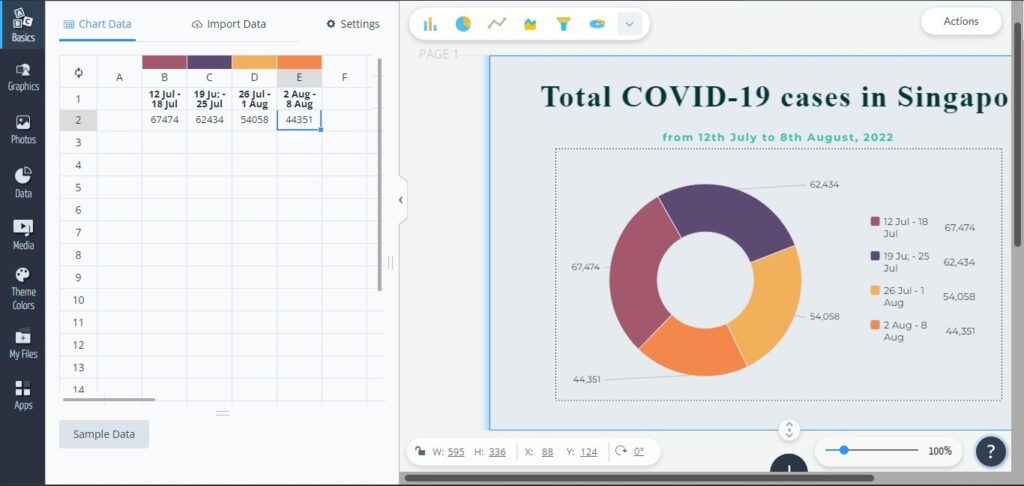
Moving to the final part is just the design and aesthetics aspects. So, we changed the color theme and formatted everything like we did previously for the infographic. Everything’s good so we move on to finalization.
5. Finalize Designs
With our 2 designs ready, all that’s left is to finalize and export them. Our output are static images so there aren’t really anything to preview before exporting them. However, as best practice, we shall preview it so we hit the ‘Present’ button at the top center.
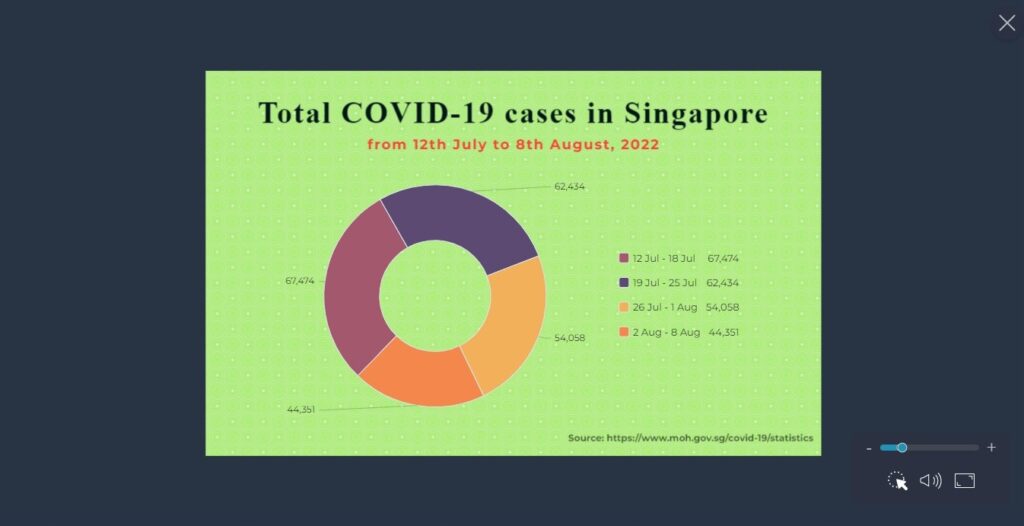
Then, after thoroughly checking through to make sure everything’s okay, we can export with either the ‘Share’or ‘Download’button at the top-right corner. If you’re sharing, you have the option of sharing via an URL link. Alternatively, you can download as a JPG, PNG, PDF, or PowerPoint file. Both our sample projects are now exported for your review in the next section. Read on!
(Comment) Unfortunately, Visme’s Basic plan doesn’t allow downloads so if you need your designs, you need to share it to obtain the link and download separately.
6. Our Final Output
 |  |
 |  |
Final Comments
After trying out Visme for its data visualization capabilities in making infographics and charts, we feel that it’s a valuable tool and certainly one to keep in mind. Of course, you’d be thinking about Canva for the same purpose, but from our experience, Visme is slightly ahead for data visualization. Hence, the question goes back to what you’d intend to use your editor for. Is it only for data charts and infographics, or videos and flyers too? Also, remember that free use of both Visme and Canva offers very limited templates and stock assets. We say, since Visme is freemium, why not alternate use every now and then to see which works? Go try!

Activities
Organisations with a data-driven decision-making culture have shown to be much more sustainable and derive greater results. What kind of data charts would you try with Visme? Tell us with a COMMENT below.
LIKE & SHARE this article to aid organisations’ move towards data culture for a resilient, decisive and sustainable business!
HASHTAG #DonutAtwork Similar tags you may be keen in: Creative Development | Digital Advertising | Social Media Management